
Debugging External Sources with Visual Studio
Have you ever needed to debug and step into a code of dependent NuGet or .NET libraries that do not build as part of your solution? Today, debugging through them is not so easy as debugging your projects that are part of your solution. Starting with Visual Studio 2022 Preview 3, we are adding a new “External Sources” node in the Solution Explorer which will make debugging external sources files much easier. This node appears while debugging and will show sources for managed modules with symbols loaded containing Source Link or Source Server information. You can effortlessly browse those sources files and debug through them by placing breakpoints if needed.
Visual Studio 2022 team is working to deliver the promise of personal and team productivity. Debugging external sources is a capability in diagnostics tools that is just one of the exciting features we are working on.
External Sources node in Solution Explorer
The feature adds a new top-level node to Solution Explorer, which appears when you are in a debugging session and any loaded symbol file (.pdb) with Source Server information will appear under this node.
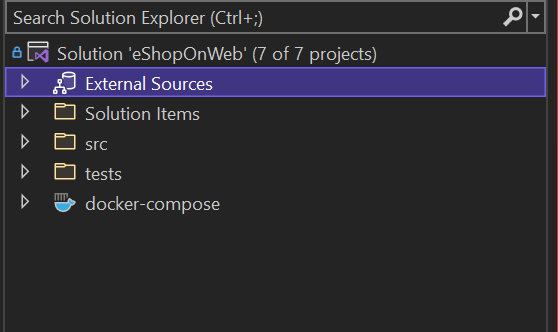 In debug mode – collapsed state (default)
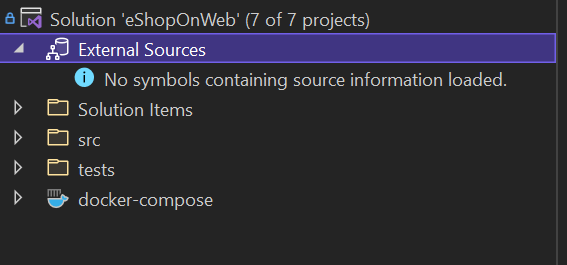 In debug mode – an expanded state with no modules with symbols outside of the solution loaded
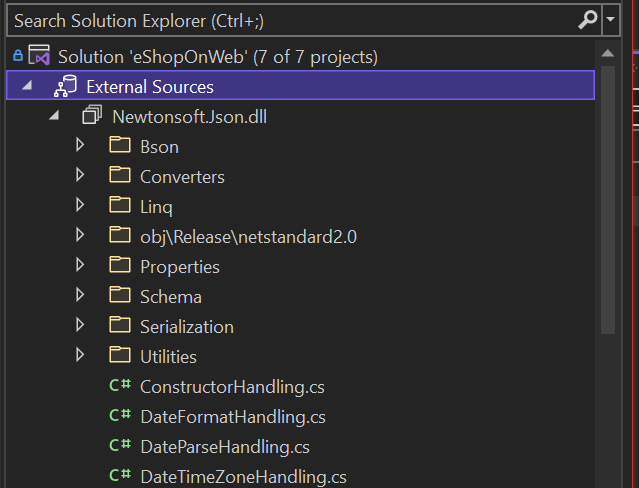 In debug mode – with one external module loaded and expanded
You can browse for files by expanding the tree items. Then, double-click an item to download the file from Source Server and open it in the editor. The node will persist with the module sources across the debugging sessions if the modules are set to load symbols automatically.
 Demo for External Sources
If you are working with applications with multiple external libraries which have their components published to Source Servers e.g. Newtonsoft.Json, CsvHelper, xUnit.net, etc. this feature will give you an easier way to browse those sources and debug through them if needed.
Settings required
The Symbol loading and source downloading can be managed by options under debugging settings.
Follow the settings checklist below to make sure modules can appear in Solution Explorer’s “External Sources” node.
- In the Tools -> Options -> Debugging options
- Disable Just My Code: This will allow the debugger to attempt to locate symbols for code outside your solution.
- In the Tools -> Options > Debugging -> Symbols options
- Enable Microsoft Symbol Server: This allows the debugger to attempt to locate symbols on Microsoft Symbol Server
- Enable NuGet.org Symbol Server: This allows the debugger to attempt to locate symbols on NuGet.org Symbol Server
- Enable Load All Modules: This allows the debugger to load symbols for all modules. (Note these options will load all available symbols, you can restrict symbol loading by selecting “Load only specified modules” and specifying included modules.)
- You may also need to check Debug -> Windows -> Modules to see which modules are currently loaded into memory and manually load any if required.
- You may be prompted to download the source from the server once you double-click the item in the “External Sources Node; click “Accept” and you can view the source code for that item in the editor.
 Demo for External Sources with manual symbol loading
Let us know what you think!
This is the first step towards creating a first-class external source debugging experience for Visual Studio. We will soon be bringing this change for native code as well. We really appreciate you taking the time to try our newest feature and we hope you will provide your honest feedback by taking this brief survey.
 Light
Light Dark
Dark
15 comments
The list of external sources can get really long. Would it be an option to group the loaded dll’s in tree nodes based on their name?
For example:
System
-System.dll
-System.IO
–System.IO.dll
–System.IO.Pipes.dll
Also, maintaining sort order for the external sources would be very welcome.
We don’t have that option today but thank you for the great suggestions. As mentioned and in the blog, this is just the first stage and we really looking for customer feedback to make it more user-friendly and productive. I will add both of your suggestions to our backlog to explore them further.
That’s a nice feature. We hacked the build process in Uno.UI to be able to debug a locally built version of our library. Pretty useful to test the impact of changes locally before pushing them to build server.
I’m wondering if there’s any way to change & recompile library files using that feature?
How we did our hack: https://github.com/unoplatform/uno/blob/master/src/crosstargeting_override.props.sample
I have just tested this feature and it works for MS/nuget.org libs but there is a problem with private nugets that we have on our company private repository. Our nugets have symbol packages on our symbol server and debugging is working – modules window is showing “Symbols loaded”, we can step into but they are not listed in “External Sources”. Is there something I’m missing? The other thing is that sorting and filtering is must have with this kind of feature.
Hello Dominik ,
Thanks a lot for trying the feature.
Yes, we are looking into implementing sorting/search for this node in the coming releases.
For the private NuGet you are having issues with; do you have the sources checked out locally for it by any chance?
Right now the modules only appear under the External Source if it has source link / source server info. It does not yet support the local resources without source link/source server details.
Feel free to reach us on vsdbgfb@microsoft.com and we can discuss your scenario in detail if needed.
I can confirm that External Sources are now working in preview4 for symbols integrated with source codes
It’s great to be able to debug NUGET packages. Until now I had to associate them as a reference just for debugging. But in debugging my main problem is remote debugging of applications installed on clients. Hope there are improvements as well because I can only debug while on the same network or domain.
Why is this a debug only feature? It would be just as useful to have access to external sources while writing code. Today I have to use ILSpy all the time.
That’s definitely a +1.
Thanks for the suggestion. That is something we might consider for our future improvements. For now, I logged a suggestion ticket to get more community feedback on this.
https://developercommunity.visualstudio.com/t/Make-the-external-sources-node-available/1513974
There seems to be a problem with that ticket:
“We were unable to get this feedback item. It could be because you don’t have access to it or it doesn’t exist
Error details: [“If you recently created this ticket, our systems are still syncing. Please refresh in 15-20 minutes and the ticket details should be available. Ticket with id ‘1513974’ not found”]”
Anyway, I’d like to +1 that suggestion, browsing the source code of referenced assemblies while writing code would be extremely useful. (ReSharper and Rider can do this, BTW.)
We also have experiences with trying to debug our own nuget packages published to Azure DevOps Artifacts.
We added Source Link support and all works fine.
The only question for me is how this feature will handle optimized code.
Because debugging optimized code is not real fun.
Breakpoints can only be set on non-optimized lines of code.
Have you any experiences with debugging optimized code?
Any pointers or hints for setting up Source Link on Azure DevOps Artifacts?
here are few that could be helpful
https://devblogs.microsoft.com/dotnet/producing-packages-with-source-link/
https://github.com/dotnet/sourcelink/
https://docs.microsoft.com/en-us/azure/devops/pipelines/release/artifacts?view=azure-devops
Love this feature!!!
But I just created the default Blazor server template app, and attempted to load the symbols for all the dlls…
Many of them came down from the server, but a handful of others would not download or could not be found on my local computer
some of these include:
system.collections.dll
system.threading.dll
system.memory.dll
and a few more…
Also, I see that we can cache the pdb files… can the source (“.cs”) files be cached too?
I spend a lot of time on an air-gapped computer, so off-line capability is very important.